NginxAlertreceiverTooMany400s#
This alert is triggered when NGINX ingress requests fail with http error code non-2xx for a given alerts_source (e.g. a client).
NGINX Ingress Controller documentation here.
Identify if Alertreceiver incident#
Before starting to troubleshoot, please make sure Alertreceiver works correctly. You can check Alertreceiver status here.
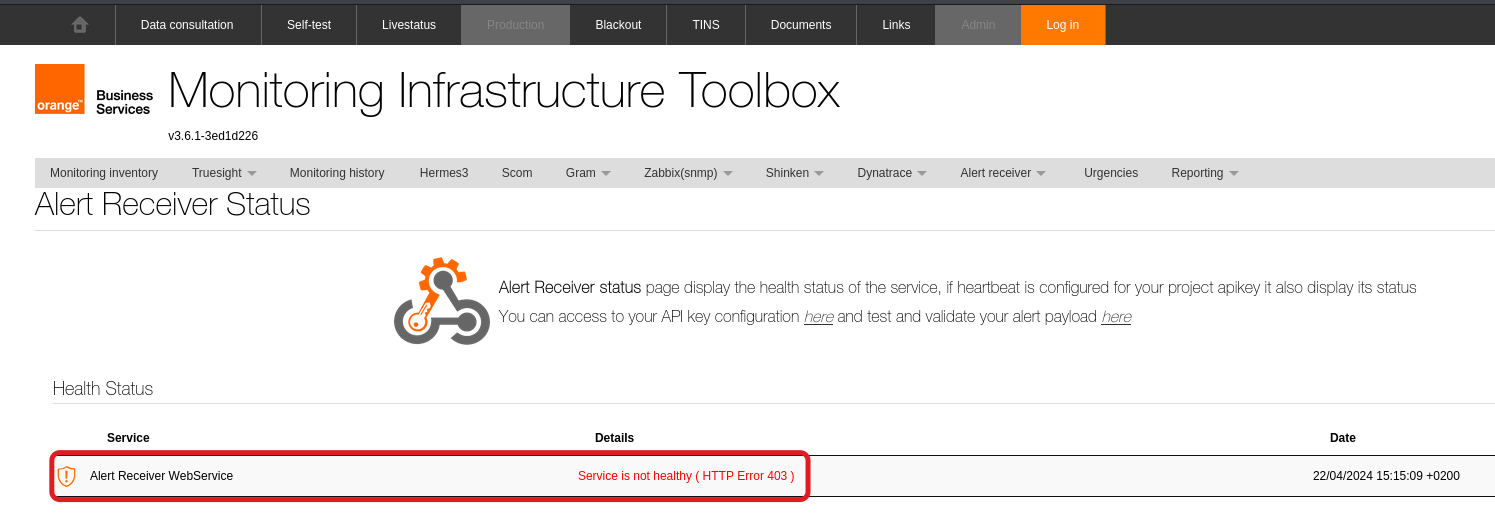
Warning
If you encounter any issues to connect to the link above, make sure the following proxy is configured in your browser: http://proxypac.si.francetelecom.fr:8080/.
If any issue on Alertreceiver side, NGOT support team need to contact the team in charge of it and provide all the informations that can help to fix the issue.
Troubleshooting hints#
Tip
In order to identify which client Alertmanager sends the failing requests, check the alerts_source label of the alert.
-
Check the logs of the pods in Grafana:
- select datasource:
Loki-client, - try this expression:
(where
{namespace="nginx-alertreceiver", cc_prom_source="prdcasa", job="nginx-alertreceiver/ingress-nginx"} | json | alerts_source='xxxxxxxxxx'xxxxxxxxxxis the client name aka thealerts_sourcegiven in the alert) - try other expressions like these:
- get all the logs for a given
request_id:where the{namespace="nginx-alertreceiver", cc_prom_source="prdcasa", job="nginx-alertreceiver/ingress-nginx"} |~ "<request id>"request_idcomes from the previous logs lines -
get all the logs of requests to
alertreceiver.prdcasa.caascad.com:{namespace="nginx-alertreceiver", cc_prom_source="prdcasa", job="nginx-alertreceiver/ingress-nginx"} |~ "alertreceiver.prdcasa.caascad.com"Note
This expression may return a lot of results, including malicious requests. This is not a problem and can be explained with the configuration of the Nginx Ingress Controller.
- get all the logs for a given
- select datasource:
-
In Grafana, check the metric
nginx_alertreceiver_requests:- Check this expression :
(where
nginx_alertreceiver_requests{alerts_source="xxxxxxxxxx"}xxxxxxxxxxis the client name aka thealerts_sourcegiven in the alert) - In the results, pay attention to these labels :
methodandpost. This expression may give better results :sum (nginx_alertreceiver_requests{alerts_source="xxxxxxxxxx"}) by (alerts_source, method, path, status) - Check if all error codes are non-
2xxor if some requests succeed.
- Check this expression :
Solutions#
Here are some possible cases
- The client is changing his configuration. This leads to failures (and alerts). Because the client also gets the explicit HTTP error codes, he may notice and fix the problem by himself.
- If the problem persists, check if the errors come from the Ingress Gateway or from Alertreceiver(CASA). See below how to communicate.
Client communication#
If NGINX ingress fails to forward alerts to AlertReceiver(CASA), impacted client needs to be informed. Detailed procedure regarding client contacts/communication here.
If NGINX ingress fails to forward alerts due to AlertReceiver(CASA) issue, it is necessary to contact the team in charge of this server via an OCEANE/SWAN ticket. Detailed procedure regarding ticket creation here.