PVCSpaceAlmostOutOfSpace#
It's an alert on the space used.
If warning, the disk is more than 95% full.
If critical, the disk is more than 97% full.
Troubleshooting hints#
We can now get the pod with one of
kubectl -n <namespace> describe pvc <pvc name> | grep ^Mount
kubectl -n <namespace> describe pvc <pvc name> | grep ^Used
- Get on the Grafana dashboard
Persistent Volumesand check the history for that disk. You may see a short augmentation. If the augmentation persists, you have a problem. If the augmentation was short and the use of the disk becomes flat again, the alert should disappear soon. Anyway, when the use of the disk is high, check if this is normal.
Known cases#
Concourse#
- If the problem occurs on concourse worker VM, checkout
ConcourseWorkerFailurealert. - Find out what pod is using the pvc
- Connect to Rancher. Select the cluster, then in "Storage" menu item, click on "Persistent Volumes". Then search...
- or with kubectl:
k describe pvc <pvc name> | grep ^Mountedwill return the pod name that mounts the PVC.
- or with kubectl:
- Check the pod:
kubectl -n <namespace> get pod <pod name> -o yamlandkubectl -n <namespace> describe pod <pod name>for more information. - You can
kubectl -n <namespace> exec -it <pod name> shfor more investigation on what is filling the FS inside the pod. - If the disk ran out of space due to concourse-postgresql (huge pg_wal ), check REX and useful troubleshooting commands.
Postgres#
Please check that the volume is not from a postgresql cluster.
If disk space is almost full for postgresql cluster, then, refer to Postgres section below, in KubePersistentVolumeUsageCritical documentation.
You can also check postgres-operator documentation
Prometheus#
The pod is *-prometheus-0 or *-prometheus-1:
- get inside the pod (
kubectl exec -it <pod name> -- sh) cd /prometheus/wal- remove all old
checkpoint.*.tmpdirectories (old means more than one day).
Loki querier#
Probable root cause:
When queries are made to retrieve logs, the querier caches indexes on disk. If queries are made over several days, new indexes are cached.
Follow the different steps in order:
-
Get on the Grafana dashboard
Persistent Volumesand check the usage for that disk to verify root cause. -
Get index directories size:
kubectl exec -it -n <logging/logging-client> querier-0 -- du -h loki/index# For client zones kubectl exec -it -n loki-client-obs-<$CLIENT> querier-0 -- du -h loki/index # For central zones kubectl exec -it querier-0 -n svc-loki-central-corp-<prd|stg> sh -- du -h loki/indexA directory corresponds to a day of index.
-
Get retention:
- Caascad-zones
- Ngot-zones: default value is 30 days, but this value can be overwritten in client zones files in zones/ngot_zones.
-
Calculates the new size of the volume:
size of a directory * retention(convert to GB). -
Extend the disk with new size:
Modify
helm: values: loki: querier: storage: sizefor the zone where there is the problem in loki.cue-
Add/modify
parameters: loki: querier: storage: sizein ngot zones file for the zone where there is the problem in zones/ngot_zones/client-<$CLIENT>.cue -
Generate the new zone files:
generate-static-zones-files
-
-
Delete statefulset and PVC:
Warning
The deletion of StatefulSet and PVC is necessary in order to take into account the configuration. During the interval where you delete the StatefulSet and PVC and you deploy the new config, the customer cannot query his logs. For this reason try to redeploy as fast as possible.
kubectl delete statefulset -n <logging/logging-client> querier
kubectl delete pvc -n <logging/logging-client> loki-index-querier-0 loki-index-querier-1 loki-index-querier-2
# For client zones kubectl delete sts querier -n loki-client-obs-<$CLIENT> kubectl -n loki-client-obs-<$CLIENT> delete pvc loki-index-querier-<x> # For central zones kubectl sts querier -n svc-loki-central-corp-<prd|stg> kubectl -n svc-loki-central-corp-<prd|stg> delete pvc loki-index-querier-<x> -
Redeploy querier:
trackbone apply -c <loki-cloud-caascad/loki-cloud-client> -z <ocb_zone>trackbone apply -c loki -z svc-loki-client-<$CLIENT> --add-services --add-children trackbone apply -c loki -z svc-loki-central-corp-<prd|stg> --add-services --add-children
Important
The trackbone plan in the MR will report only the suppression of the StatefulSet. This is not an issue.
Note
If this alerts fires too much, some refactoring may be necessary. Some reflection has already been done here.
Thanos Receive#
If you encounter disk usage issues on Thanos-receiver, use this procedure to scale-up Thanos-receiver.
Warning
Never update the memory R/L or volume size of a thanos-receiver-X pod/Statefulset. Follow the documentation and add a new replica instead.
Thanos Storegateway#
Probable root cause: large indexes are stored in s3.
Follow the different steps in order:
Caascad#
Tip
Below, <monitoring_namespace> can be:
- Zone Cloud:
monitoring,monitoring-clientormonitoring-app - Zone Infra:
monitoringormonitoring-consumption
More information in Caascad namespaces naming.
-
Get on the Grafana dashboard
Persistent Volumesand check the usage for that disk to verify root cause. -
Choose a new size from the 30 day increase.
-
Extend the disk with new size: modify
helm: values: thanos: storeGateway: claimSizefor the zone where there is the problem in thanos.cue
Warning
The next steps (4 and 5) should be done quickly to minimize service interruption.
Moreover, trackbone apply must be done locally (not via CI) too to minimize interruption.
-
Delete statefulset and PVC
kubectl delete statefulset -n <monitoring/monitoring-client> thanos-monitoring-client-store-gateway kubectl delete pvc -n <monitoring/monitoring-client> thanos-store-gateway-data-volume-thanos-monitoring-client-store-gateway-0 -
Redeploy Storegateway:
trackbone apply -c <thanos-infra-caascad/thanos-cloud-caascad/thanos-cloud-client/thanos-cloud-app> -z <ocb_zone>
Note
As a deletion has been made, there will be many differences during the trackbone apply.
Central NGOT (mon3/mon4)#
Central NGOT mon3/mon4 have a specific procedure to extend the volumes.
Client NGOT#
Tip
Notice the namespace label in the alert.
-
Check the usage for that disk to verify if it is close to 100% utilization.
kubectl exec -it thanos-store-gateway-0 -n monitoring-stack-client-obs-XXX -- df -h /data -
Extend the disk with new size: added or modify
storeGateway: storage: size: "XXXXGi"for the zone where there is the problem in zones/ngot_zones/Client-XXX.cue.Example:
parameters: {
    thanos: {
        storeGateway: storage: size: "XXXXGi"
    }
}
You need to regenerate the static zones files.
git pull
nix-shell
generate-static-zones-files
Reminder: You need to execute the following code in the
envs-ngfolder.
Warning
The next steps (3 and 4) should be done quickly to minimize service interruption.
Moreover, trackbone apply must be done locally (not via CI) too to minimize interruption.
-
Scale down Statefulset and remove PVC
kubectl -n monitoring-stack-client-obs-XXX delete statefulset thanos-store-gateway kubectl -n monitoring-stack-client-obs-XXX delete pvc thanos-store-gateway-data-volume-thanos-store-gateway-0 -
Redeploy Storegateway:
trackbone apply -z svc-monitoring-stack-client-XXX -c thanos-storeReminder: You need to execute the following code in the
envs-ng/contexts/ngotfolder.Note
When running
trackbone apply, the difference may surprise you: it will show the deletion of the Statefulset whereas you want to deploy it (with a new storage size). This is normal and you can validate the deployment withyes.
Verification:
We keep the ticket for 24 hours to monitor the client's usage, then set a minimum size of 20%. It's up to you to decide.
-
Get on the Grafana Corp Prd or Grafana Corp Stg dashboard
Kubernetes TMP, thenPersistent Volumes, and check the usage for that disk to verify the cause. -
Choose an absolute time range size of 30 days. By setting the time range to 30 days, you can observe a slow and steady growth process.
Thanos Compactor#
This known case concerns NGOT clusters that host the central monitoring system and can manifest when Thanos Compactor performs compaction of a large amount of data.
Alert Evaluation#
This alert assesses the time remaining before the volume becomes full. It operates under the assumption that disk usage will continue to increase at the same rate as it was when the alert was triggered.
Specifics of Thanos Compactor#
For the Thanos Compactor, the compaction period is limited in time. Once compaction is complete, disk usage will return to normal without any intervention.
The increasing disk usage occurs because Thanos Compactor initially compacts data on the local disk before transferring it to S3 storage.
Characteristics of the Thanos Compactor Known Case#
- Impacted Clusters:
kub-53(mon3) and/orkub-34(mon4) - Occurance week-day: Thursday
-
Frequency: This occurs every 14 days following the last raw data compaction. You can verify this by checking the Grafana Persistent Volume Dashboard:
- Datasource:
thanos - Namespace:
monitoring-stack-corp-obs-corp-prd - PersistentVolumeClaim:
thanos-compactor-data-volume-thanos-compactor-0 - Cluster:
kub-53/kub-34
Tip
To obtain the
Namespace,PersistentVolumeClaim, andClusterinformation, check the labels in the Karma alert. - Datasource:
Identifying the Known Case#
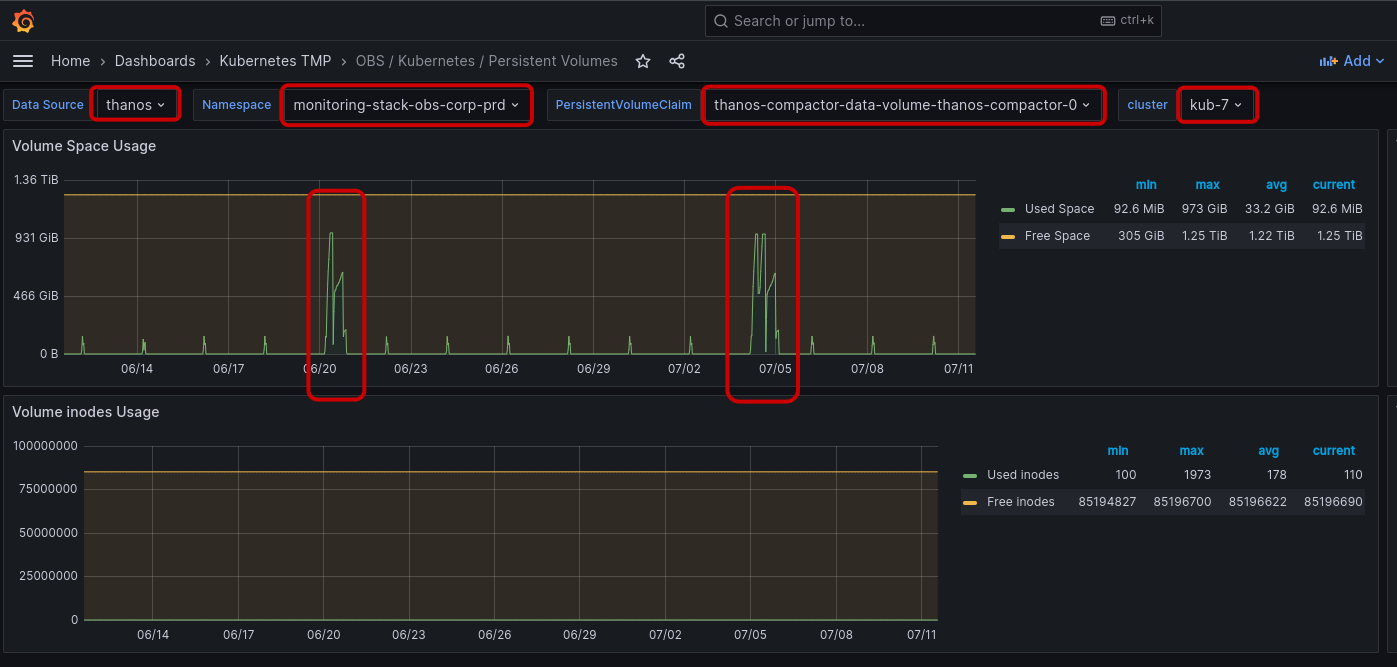
If this is the known case, you should observe a peak in disk usage 14 days prior (as raw data is compressed every 14 days). An example is shown in the image below:
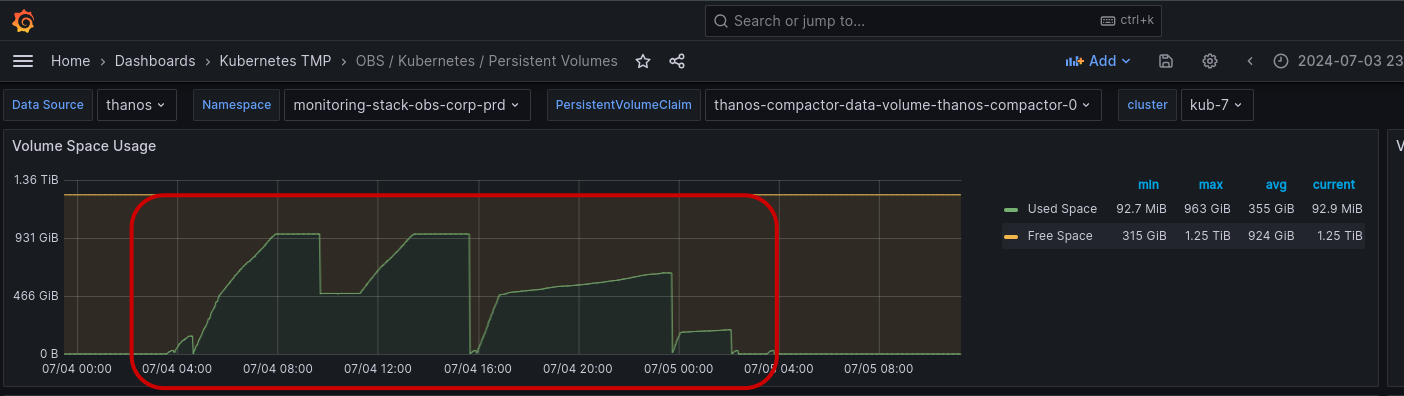
Compaction starts at 4 AM and generally lasts for 24 hours. Typical disk usage during compaction can be seen in the image below:
Recommended Actions#
If you are in this known case, no action is required. However, if the alert persists for more than 24 hours, further troubleshooting may be necessary, and a volume extension may be required.
Solutions#
- use case: there is no way to clean unnecessary data. Extend the disk/filesystem (except for Thanos-Receiver : follow this procedure instead).