NginxAlertreceiverLatencyHigh#
This alert is triggered when NGINX ingress latency is high for more than 5 minutes.
The criticity of this alert depends on the latency level:
- warning: if NGINX ingress latency is higher than 2s.
- critical: if NGINX ingress latency is higher than 5s.
NGINX Ingress Controller documentation here.
Identify if Alertreceiver incident#
Before starting to troubleshoot, please make sure Alertreceiver works correctly. You can check Alertreceiver status here.
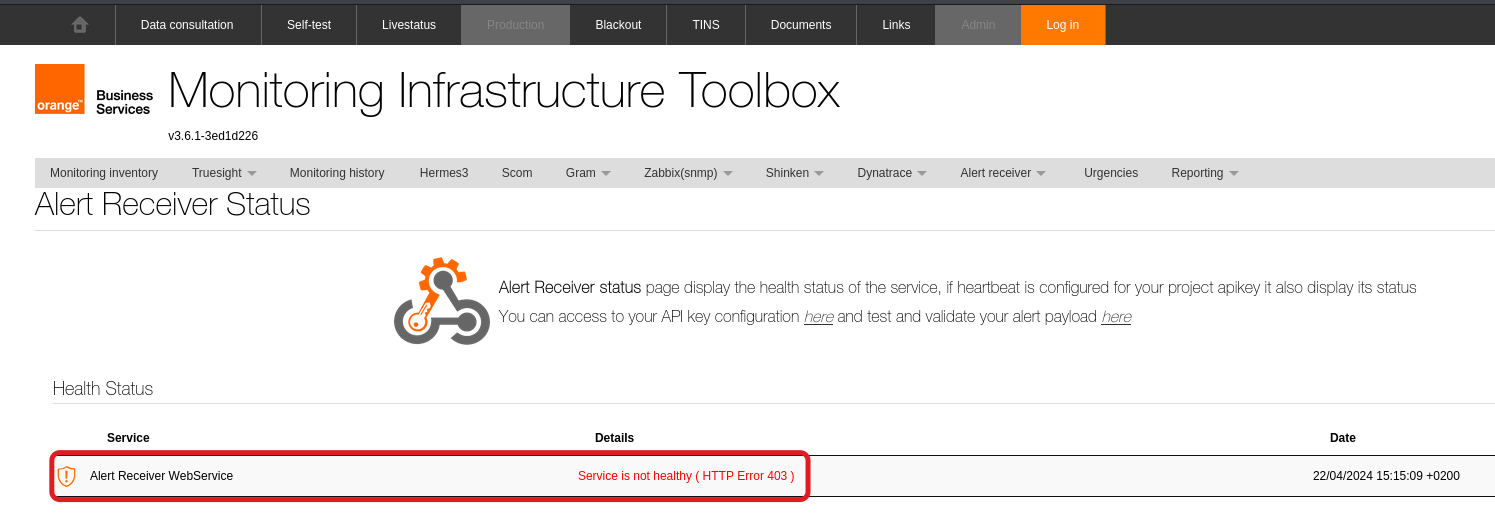
Warning
If you encounter any issues to connect to the link above, make sure the following proxy is configured in your browser: http://proxypac.si.francetelecom.fr:8080/.
If any issue on Alertreceiver side, NGOT support team need to contact the team in charge of it and provide all the information that could help them to fix the issue.
Incident identification#
It is important to identify whether the latencies appear for one or for multiple customers and to identify them.
There are two possibilities to visualise the logs:
- in Grafana:
- datasource:
Loki-client; - PromQL query:
{namespace="nginx-alertreceiver"}.
- datasource:
-
on prdcasa cluster, you can parse the logs of
nginx-alertreceiverpods to extract informations regarding:- client alertmanager : identified in the logs by
alerts_sourcelabel; - http status code : identified in the logs by
statuslabel.
Example :
kswitch prdcasa
kubectl logs -l app.kubernetes.io/instance=nginx-alertreceiver --since=1h30m -n nginx-alertreceiver \
    | grep '^{"time'| jq -r 'select(.alerts_source) | "\(.alerts_source): \(.status)"' \
    | sort \
    | uniq -c \
    |awk '{print $2 " " $3 " => "$1}'
Note
Different filters are present in the previous example:
--since: allow you to limit the logs related to the incident. You can obtain this information from Karma;- the label
app.kubernetes.io/instance=nginx-alertreceiver: returns logs from both nginx-alertreceiver pods; time: to be sure the json format is not broken.
The example above will have the following type of output:
amc: 200 => 93
ekara: 200 => 3
gd: 404 => 372
lrdm: 200 => 1
osp: 200 => 18
rsh: 200 => 5
rsh: 406 => 8
sqrs: 200 => 63
svczo: 200 => 16
svczo: 406 => 1
wg: 200 => 30
wlssec: 200 => 5
In the output, each line contains three type of informations:
- client name;
- http status code sent to each client alertmanager. You need to analyse the different http codes except
200; - total number of requests for each client alertmanager and the differents status code they received from nginx-alertmanager.
- client alertmanager : identified in the logs by
Note
More details regarding the different http status code used by Alertinghub can be found here.
These informations allow you to identify if a particular http error code is present for one or multiple customers:
- is it an isolated case (only one customer has a high number of http error code), then the issue is probably on client alertmanager side. In this case check all the alerts in client Grafana, Alerting menu;
- is it a general issue (same http error code for multiple/all customers). In this case you need to contact the team in charge of Alertinghub for them to identify why it has troubles to accept alerts from NGOT nginx-alertmanager.
Troubleshooting hints#
-
Check that two ingress pods are present and running (
replica=2):kubectl get pod -n nginx-alertreceiver -
Check that the ingress is present and the ressource events:
kubectl get ingress -n nginx-alertreceiver kubectl describe ingress <nginx-ingress-name> -n nginx-alertreceiver -
Check the logs of the pods.
-
In Grafana, check the following dashboards:
NGINX Ingress controller (Alertreceiver)Nginx Request Handling Performance (Alertreceiver)
Note
In Grafana, use:
- datasource:
Thanos-client - cluster:
prdcasa
Client communication#
If NGINX ingress fails to forward alerts to AlertReceiver(CASA), impacted client needs to be informed. Detailed procedure regarding client contacts/communication here.
If NGINX ingress fails to forward alerts due to AlertReceiver(CASA) issue, it is necessary to contact the team in charge of this server via an OCEANE/SWAN ticket. Detailed procedure regarding ticket creation here.