Troubleshooting Prometheus target#
Introduction#
When a metric is missing, Prometheus is usually the right place to go debugging into.
- Find the target
- Check if the target is healthy
Prometheus UI#
Prometheus UI will help to find the scrapping target. Its state will give indications why the metric is missing.
Step 1: find which Prometheus to connect to#
- When an alert happens, its labels usually give enough information to find which Prometheus to connect to, including the namespace.
- For probes of Blackbox-Exporter on NGOT, Prometheus is one of the central monitoring stacks (kub-34 or kub-53).
Step 2: port-forward to Prometheus (port 9090)#
kubectl -n <namespace> port-forward <prometheus pod> 9090:9090
# or
kubectl -n <namespace> port-forward svc/<prometheus service> 9090:9090
kubectl -n monitoring-stack-corp-obs-corp-prd port-forward svc/prometheus-operated 9090:9090 &
kubectl -n monitoring port-forward svc/cluster-prometheus 9090:9090 &
Get the namespace with kubectl get ns | grep monitoring; see the correspondance in the Caascad namespaces nomenclature :
$ kubectl -n caascad-monitoring get svc -l app=kube-prometheus-stack-prometheus
NAME                 TYPE        CLUSTER-IP      EXTERNAL-IP   PORT(S)    AGE
caascad-prometheus   ClusterIP   172.20.73.157   <none>        9090/TCP   163d
$ kubectl -n caascad-monitoring port-forward svc/caascad-prometheus 9090:9090 &
Step 3: check the targets#
Check the targets on http://localhost:9090/targets.
- Clear the selection to ensure you check all the targets
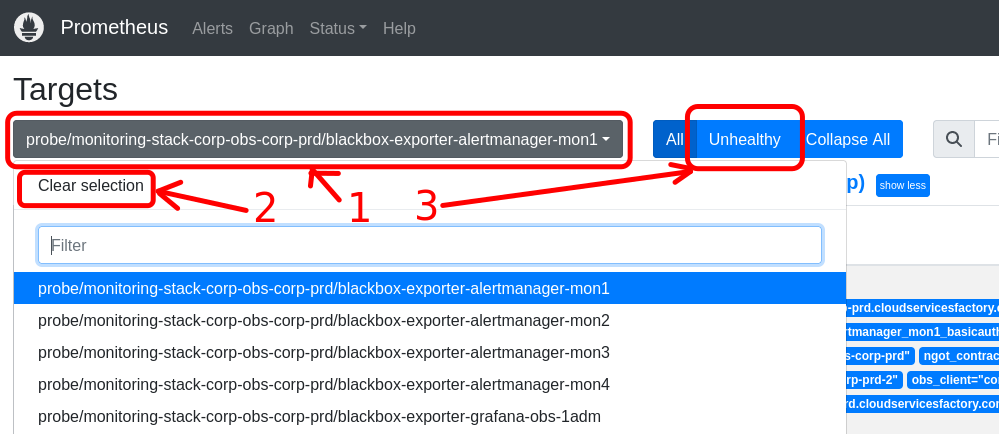
- Check if the target for the probe is present and is OK.
- if it is absent, check the PodMonitor, ServiceMonitor or the Probe: it may be absent or be badly defined. See the section Missing ServiceMonitor or Probe below.
- if it is present but not OK, this UI should explain why.
- check the known cases in Broken target section below
- If the case is unkwnown, check the Generic debugging targets section below.
Broken target#
The target exists but is not OK. In this case, Prometheus gives the reason why.
Known case: 400 Bad Request#
An HTTP error code 400 Bad Request can indicate a missing configuration, like an absent Blackbox-Exporter module.
In this case, you can try to apply master:
cd contexts/ngot
trackbone apply -z $ZONE -c blackbox-exporter-core -t blackbox_exporter_refresh_cache=true --add-services
Where ZONE can be identified with the label cluster in the alert.
Known case: old target not removed#
In this case, the autoscaler removed a Kubernetes node and some pods were moved to other nodes. Prometheus may have detected the new pods, but has not detected the disparition of the old ones. The Prometheus Discovery failed (bug ?).
Solution: restart Prometheus. This will restart its discovery from scratch and forget the broken targets.
Known case: DNS problem#
The target error message explains that the resolution fails.
In this case, run kubectl exec -it <prometheus pod> -c prometheus -- sh to log in, then try to resolve the target names. It may confirm the NS resolution problem and give more information in the error message.
If the DNS issue is confirmed, the investigation should move to the NS resolvers. When it is fixed, Prometheus should redetect automatically its target correctly. If not, restarting Prometheus pod may help.
Known case: Postgresql#
When the target down is a member of postgres cluster (example: concourse-infra/postgresql or gitea/postgres), it can be due to the fact that one or more pods in postgres cluster have a desynchro resulting increase of wal files, that will explose the volume attached to pod (high volume of Lag).
If it's the case, please see more information in documentation :
- for alert PostgresAlerts.
- for volume KubePersistentVolumeUsageCritical.
- for postgreSQLMemberDown PostgreSQLMemberDown.
Generic debugging targets#
Note
- Caascad: Specific case of
/federate: there is no service there. The target is direct to another Prometheus. Check the other Prometheus. - NGOT: When the namespace is
monitoring-stack-corp-xxxthe information below will help to know for which component the target is down:service=thanos-receive: this is the specific receiver that we name "distributor".service=thanos-receive-headless: it is one of the receivers that ingest the metrics and send them to S3.service=thanos-query, this is the Querier dedicated to the Ruler in the central monitoring stack.service=thanos-query-proxy-query, this is the Querier that we name "proxy" in the central monitoring stack.
-
Find the service :
kubectl get service -n <namespace> <service name> --show-labelswherenamespaceandservice namecome from the target definition as seen in Prometheus. -
Find the IP and port (usually from
kubectl get service <service name> -o yaml, but if the IP is missing, also checkkubectl get endpoint <service name> -o yamlwith the same name as the service) -
Try
curl http://<IP>:<port>. Usually the IP is not public. You have to do a port-forward on the service :kubectl port-forward svc/<service name> 9090:<port>andcurl localhost:9090/metrics(sometimes it is not/metrics: check this in the Prometheus targets as seen in step 1).- If the curl command returns an unexpected result, investigate on this result: it may lead you to the root cause of the issue.
- If the curl command returns the expected result but the target is still down, investigate on the ServiceMonitor: it may contain a wrong definition.
Missing ServiceMonitor or Probe#
Known case: forgotten deployment#
In most cases, the PodMonitor, ServiceMonitor or Probe is just not deployed. Check the deployment procedure and redeploy. The target should appear soon.
Known case: bad definition#
PodMonitors, ServiceMonitors and Probes need Kubernetes labels to be detected by Prometheus-Operator and to be injected into the Prometheus configuration.
Check the PodMonitors, ServiceMonitors and Probes pre-requisites for labels if they are correctly set.
Try to deploy the PodMonitor, ServiceMonitor or Probe. In some case, a syntax error may appear in the definition and prevent Kubernetes to accept it.
Follow the documentation how to create a serviceMonitor, section Verify prometheus Target