Troubleshooting the copy of metrics between NGOT environments#
Introduction#
If you cannot visualise the metrics on destination Prometheus, you can have a check on the components described below.
Convention
In this procedure the following convention is used:
$SOURCE_CLIENT: the name of the environment that contains the metrics (example:test06);$DEST_CLIENT: the name of the environment where you want to copy the metrics (example:test05).
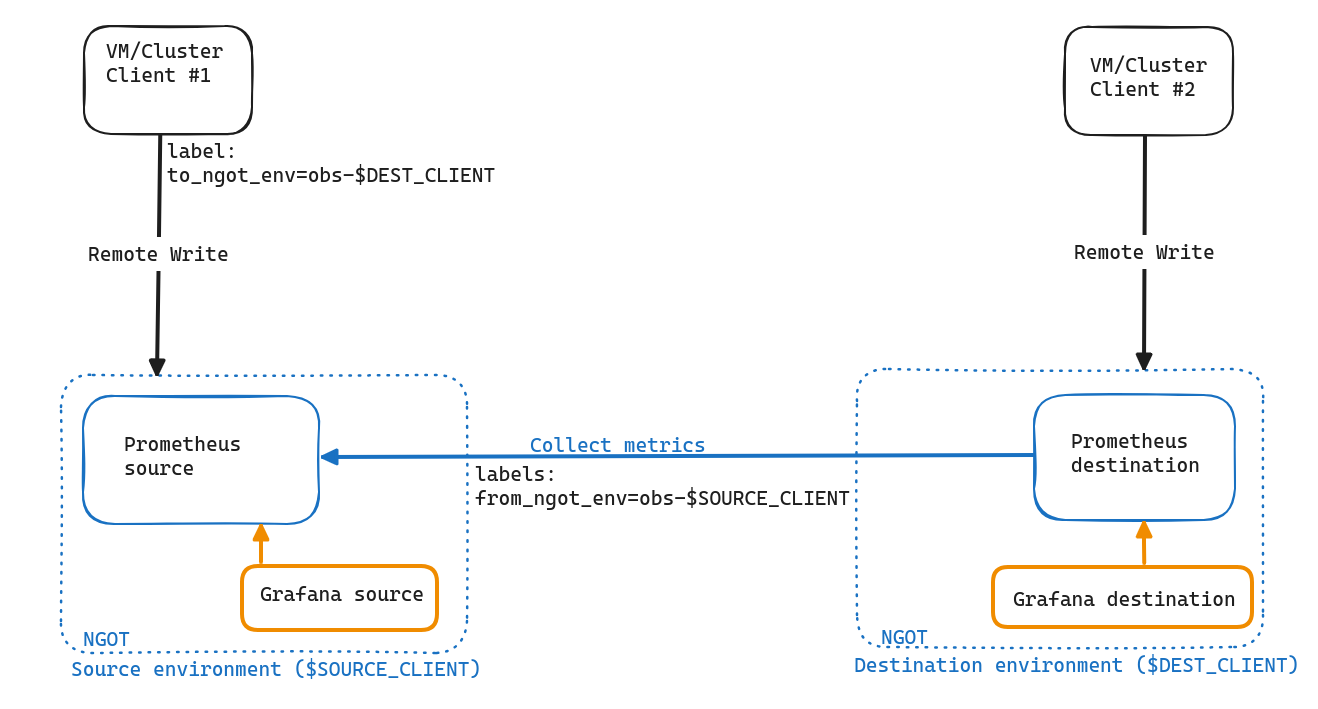
The following schema explains the federation arhitecture:
Source Prometheus#
Note
In this section, all objects that play a role in the federation are in monitoring-stack-client-obs-$SOURCE_CLIENT namespace.
In order to validate the configuration on source environment, check:
- the presence of ingress
obs-$SOURCE_CLIENT-prometheus(example:obs-test06-prometheus); - that source Prometheus ingress username and password are correctly written in Vault at this location:
/secret/zones/fe/svc-monitoring-stack-client-$SOURCE_CLIENT-prometheus-federate-auth; - the connectivity from destination environment towards source Prometheus:
kswitch ${DEST_CLIENT} curl http://prometheus.obs-${SOURCE_CLIENT}.cloudservicesfactory.com/federate --user "<ingress_username>:<ingress_password>" -
in Grafana of the source environment check that the value of
to_ngot_envlabel contains the name of the destination environment (obs-$DEST_CLIENT).Warning
If the metrics are present but the label
to_ngot_envis absent, you need to check with the customer to ensure that the labelto_ngot_envis correctly set at source (e.g.: Telegraf).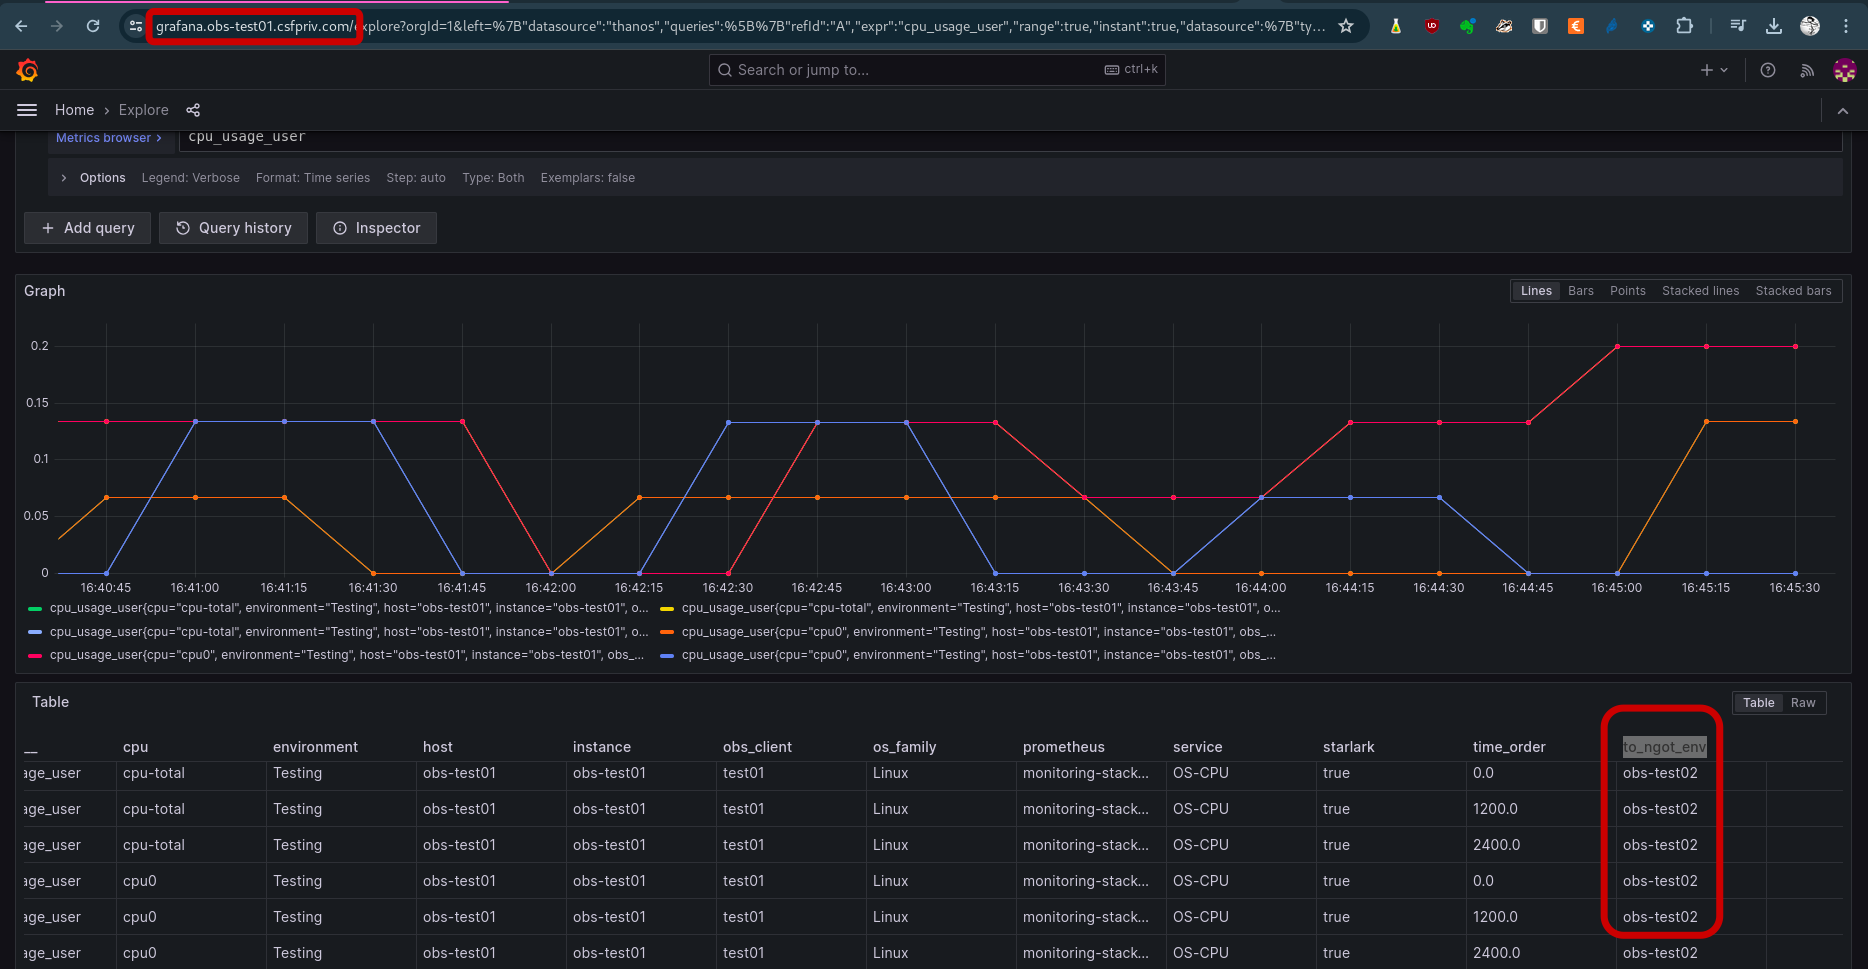
Destination Prometheus#
Tip
In this section, all objects that play a role in federation are in monitoring-stack-client-obs-$DEST_CLIENT namespace.
In order to validate the federation configuration on destination environment, check:
- the presence of service
federate-metrics; - the presence of servicemonitor
federate-$SOURCE_CLIENTand check the contents:- list of metrics,
Spec.Selector.MatchLabels.JobName:federate-metrics,- username and password to authenticate on source environment ingress (they need to be the same as the ones in the Vault of the source environment);
- the presence of secret
federate-$SOURCE_CLIENT, -
on Prometheus UI (menu Status > Targets), with a port-forward on Prometheus, if the federation target (endpoint
http://prometheus.obs-$SOURCE_CLIENT.cloudservicesfactory.com/federate) is up; if it's in error state, check the error log:
-
check the name of the metrics that need to be copied:
kswitch svc-monitoring-stack-client-${DEST_CLIENT} # example: kswitch svc-monitoring-stack-client-test05 kubectl get smon federate-${SOURCE_CLIENT) -n monitoring-stack-client-obs-${DEST_CLIENT} -o yaml # example: kubectl get smon federate-test06 -n monitoring-stack-client-obs-test05 -o yaml -
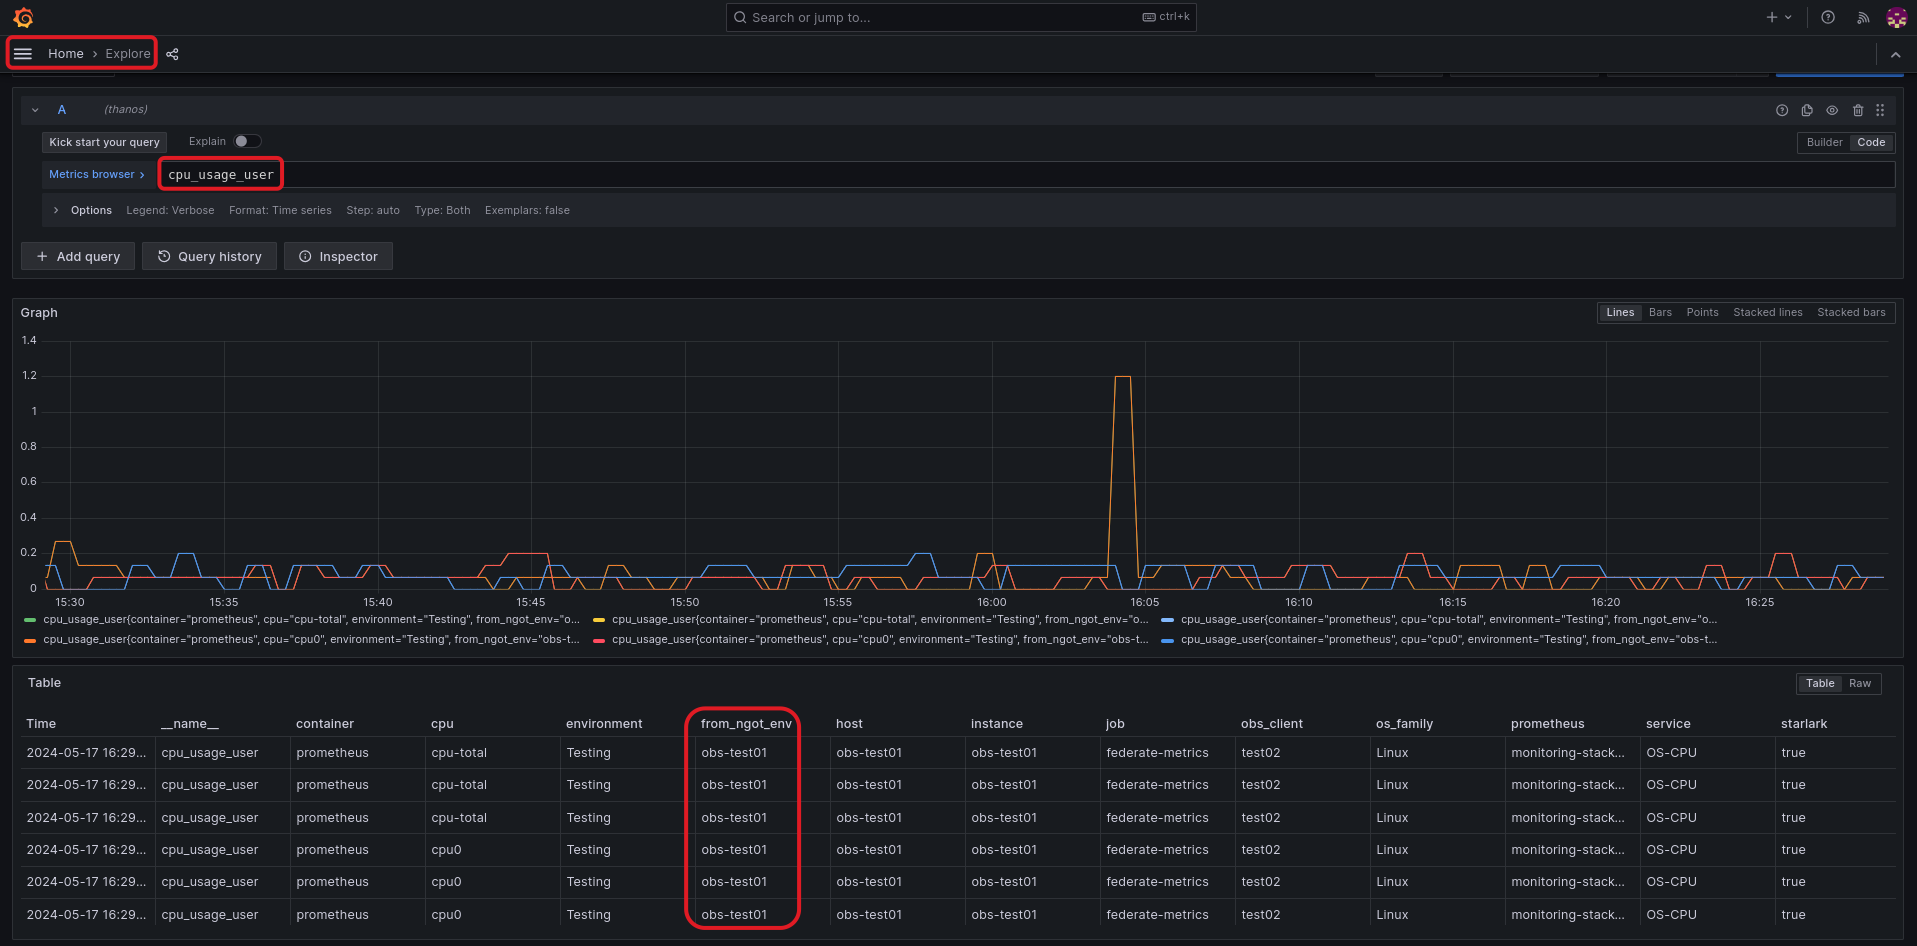
in client Grafana of the destination environment:
- check if the metric is present and has the label
from_ngot_env=$SOURCE_CLIENT, this label is added during federation and is useful to identify source environment of the metrics:
- check if the metric is present and has the label