Troubleshooting Missing Metrics#
Introduction#
When metrics are missing, the first step is to determine whether the issue originates on the customer side or the NGOT side. This procedure describes how to eliminate NGOT Resources as the Root Cause.
Prometheus#
-
Verify Prometheus availability
Check that both Prometheus instances receiving metrics via remote-write from the customer are up and running:
kswitch svc-monitoring-stack-client-<CLIENT>
kubectl get pods -l app.kubernetes.io/name=prometheus -n monitoring-stack-client-obs-<CLIENT>
kubectl logs -l app.kubernetes.io/name=prometheus -n monitoring-stack-client-obs-<CLIENT>
If everything looks fine, proceed to the next step.
-
Check Alertmanager metrics on customer Grafana
Log in to the customer Grafana instance:
https://grafana.obs-<CLIENT>.cloudservicesfactory.com/loginLook for metrics such as:
alertmanager_receivers,alertmanager_alerts,alertmanager_notifications_total.These metrics are not collected from the customer's environment — their presence confirms that Prometheus is functioning properly.
-
Check remote-write status from the corporate Grafana:
https://grafana.obs-corp-prd.cloudservicesfactory.com/.Use the following query:
If the graph shows a sudden drop or drops to zero (as in the example below), this indicates that Prometheus is not receiving any metrics. The issue is not on Prometheus's side.increase(prometheus_http_requests_total{obs_client="<CLIENT>", handler="/api/v1/write"}[5m])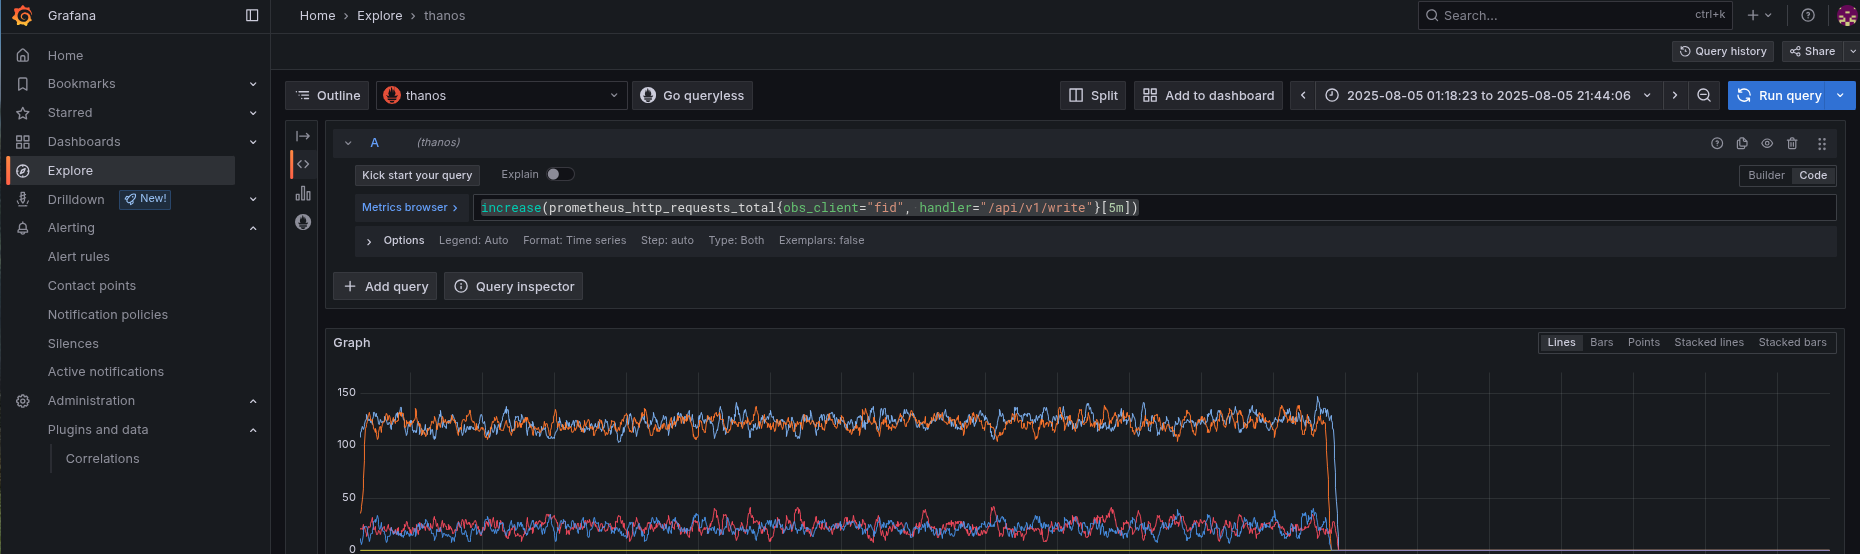
Check also the label
codewhich indicate the http status code returned by Prometheus. If the status code is in the range2xx,3xx, or4xx, the issue is not on Prometheus (server) side. -
Confirm chunk timestamps inside Prometheus
To further verify Prometheus, inspect the most recent chunk timestamps:
kubectl exec -it prometheus-obs-<CLIENT>-prometheus-0 -n monitoring-stack-client-obs-<CLIENT> -- ls -lrth /prometheus
Ingress Controller#
Check the ingress controller responsible for exposing Prometheus:
kubectl get pods -l app.kubernetes.io/instance=ingress-nginx-v2-public -n ingress-nginx-v2-public
kubectl logs -l app.kubernetes.io/instance=ingress-nginx-v2-public -n ingress-nginx-v2-public
DNS Resolution#
Disconnect from VPN, to simulate external access.
Get remote-write hostnames:
kubectl get ingress -n monitoring-stack-client-obs-<CLIENT> | grep prometheus
Test from your phone the Prometheus remote_write URLs:
https://remote-write-0.obs-<CLIENT>.cloudservicesfactory.comhttps://remote-write-1.obs-<CLIENT>.cloudservicesfactory.com
If prompted for credentials, DNS is correctly resolving.
Conclusion#
If all above checks pass, you can confidently inform the customer that the issue is on their side.
Share the official documentation for configuring remote-write in Telegraf.