Copy metrics between NGOT environments#
Introduction#
This procedure is to be applied when a customer makes a request to copy some metrics from one environment to another.
This can be useful when a customer team monitors several client environments and wants to use only one Prometheus to query metrics or fire alerts.
Convention
In this procedure the following convention is used:
$SOURCE_CLIENT: the name of the environment that contains the metrics to copy (example:test06);$DEST_CLIENT: the name of the environment where the metrics are copied (example:test05).
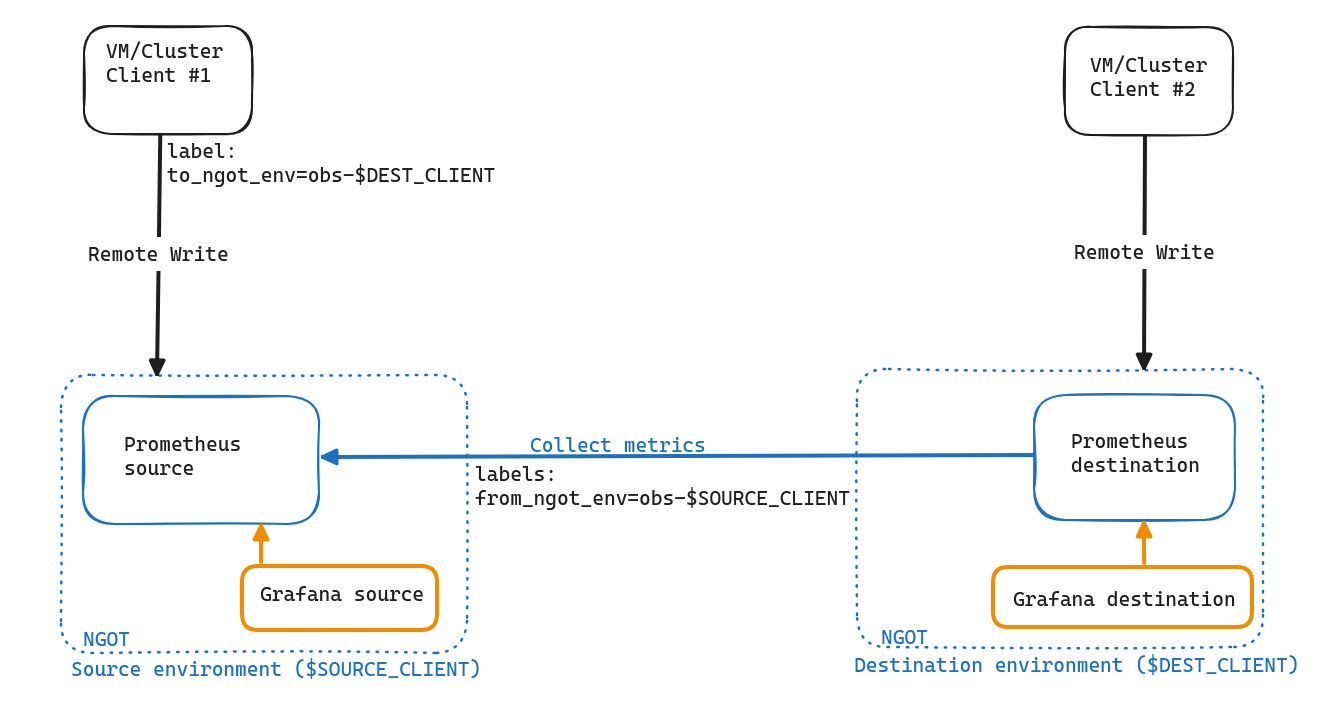
The following schema explains the federation architecture:
Configuration#
In order to set up the copy of metrics between NGOT environments, you need to configure the zone files of source and destination service zones and apply the configuration.
Source Prometheus#
Tip
The souce Prometheus may already exposes its federation API, e.g. expose_prometheus_federate may already be set to true.
In this case, you can jump to the next section.
Check with this command:
sd get zones | jq -r --arg c "${SOURCE_CLIENT}" '.["svc-monitoring-stack-client-"+$c].parameters."monitoring-stack".prometheus."expose_prometheus_federate"'
To activate the federation on source Prometheus, add expose_prometheus_federate: true in the following section:
_zones: {
        "svc-monitoring-stack-client-${SOURCE_CLIENT}": {
                parameters: {
                        "monitoring-stack": {
                                 prometheus: {
                                        expose_prometheus_federate: true
                                 }
                        }
                }
        }
}
This configuration will exposes source Prometheus API:
- deploys a private ingress named
obs-$SOURCE_CLIENT-prometheusinmonitoring-stack-client-obs-$SOURCE_CLIENTnamespace that will expose source Prometheus at this url:http://prometheus.obs-$SOURCE_CLIENT.cloudservicesfactory.com/federate; - writes ingress username and password (basicAuth) in Vault at this location:
/secret/zones/fe/svc-monitoring-stack-client-$SOURCE_CLIENT/prometheus-federate-auth.
Destination Prometheus#
To configure destination Prometheus to scrape metrics from source Prometheus, you need to modify the zone file of the destination environment and define:
- the source environment and
- the list of metrics to scrape.
Note
In case the customer wants to copy metrics to multiple destination environments, you need to make the following configuration for each destination environment.
Configuration example:
_zones: {
    "svc-monitoring-stack-client-${DEST_CLIENT}": {
        parameters: {
            "monitoring-stack": {
                prometheus: {
                    federate_zones: {
                        "${SOURCE_CLIENT}": params: "match_labels": [{
                            key:       "__name__"
                            operation: "=~"
                            value:     "probe_success|probe_duration_seconds|cpu_usage_user"
                        }]
                    }
                }
            }
        }
    }
}
$DEST_CLIENT environment will scrape Prometheus of $SOURCE_CLIENT environment and will retrieve only the metrics that match the list.
Metrics filter description:
key: label key to be used to filter metrics. In this example the key is the name of the metrics, but you can use other labels like:namespace,obs_client,job,container, etc.;operation: binary comparison operators to use. In this example the operation is equal, but other operators are described here;value: list of metrics to match.
Note
In the list of the metrics you can also use regex format (example: fg* (fgSysCpuUsage, ...), if* (ifOperStatus, ...)).
Generate the zones files and make an MR#
As usual:
SOURCE_CLIENT=xxxx # example : test06
DEST_CLIENT=yyyy   # example : test05
ENVS_NG=xxx        # example : $HOME/git/caascad/terraform/envs-ng
cd ENVS_NG
nix-shell
generate-static-zones-files
git add zones/ngot_zones/client-${SOURCE_CLIENT}.cue
git add zones/ngot_zones/client-${DEST_CLIENT}.cue
git add gen/
git commit -m "federate metrics: from ${SOURCE_CLIENT} to ${DEST_CLIENT}"
Deployment#
On source environment:
Warning
If the souce Prometheus already expose its federation API, do not update the source Prometheus configuration.
Update source Prometheus configuration:
trackbone apply -c kube-prometheus-stack -z svc-monitoring-stack-client-${SOURCE_CLIENT}
Blackbox-Exporter is used to monitor the federation in NGOT:
trackbone apply -c blackbox-exporter-core -z svc-monitoring-stack-corp-prd-1 -t blackbox_exporter_refresh_cache=true
trackbone apply -c blackbox-exporter-core -z svc-monitoring-stack-corp-prd-2
trackbone apply -c blackbox-exporter-probe-monitoring-stack-client-mon3 -z svc-monitoring-stack-client-${SOURCE_CLIENT} --add-services
trackbone apply -c blackbox-exporter-probe-monitoring-stack-client-mon4 -z svc-monitoring-stack-client-${SOURCE_CLIENT} --add-services
federate-prometheus-obs-$SOURCE_CLIENT to test source Prometheus URL availability on svc-monitoring-stack-corp-prd-{1,2} environment (monitoring-stack-corp-obs-corp-prd namespace).
Prometheus rules:
trackbone apply -c prometheus-rules -z svc-monitoring-stack-corp-prd-1 --add-services
trackbone apply -c prometheus-rules -z svc-monitoring-stack-corp-prd-2 --add-services
/http_2xx_federate_prometheus_obs-$SOURCE_CLIENT_basicauth in BlackboxMetricsMissing alert.
On destination environment:
Deploy servicemonitor:
trackbone apply -c client-federate-metrics-servicemonitor -z svc-monitoring-stack-client-${DEST_CLIENT}
Validation#
To check that the copy of metrics works correctly:
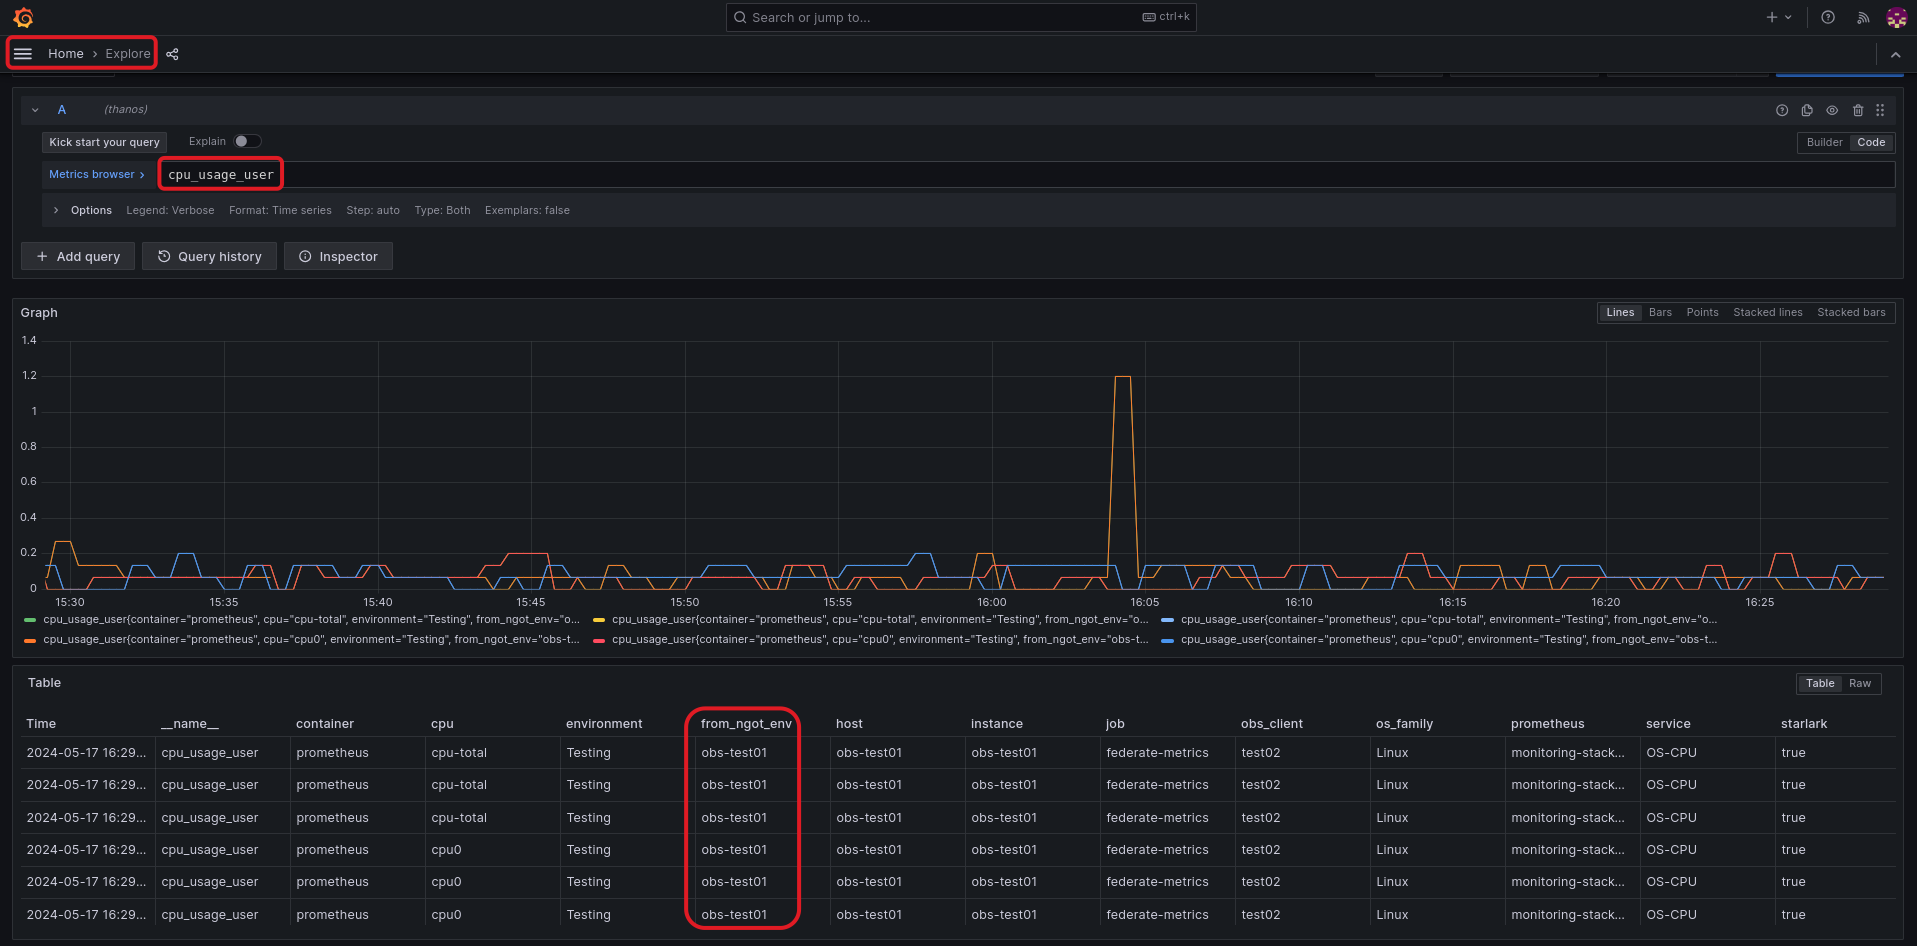
- go to Grafana interface of the destination environment (
$DEST_ENV); - in Explore Menu, select Thanos datasource, make a query of a metric that you requested to copy from another environment:
- check the presence of the metrics;
- check the presence of the label
from_ngot_env=$SOURCE_ENV: provides information regarding the source of metrics.
Note
In order to identify the source environment of metrics, the label from_ngot_env is added during federation. It is helpful particulary in the scenario in which you copy metrics from multiple environments to a single destination.
If you encounter any issues, please follow the troubleshooting procedure here.