Monitoring architecture (Caascad)#
Schema#
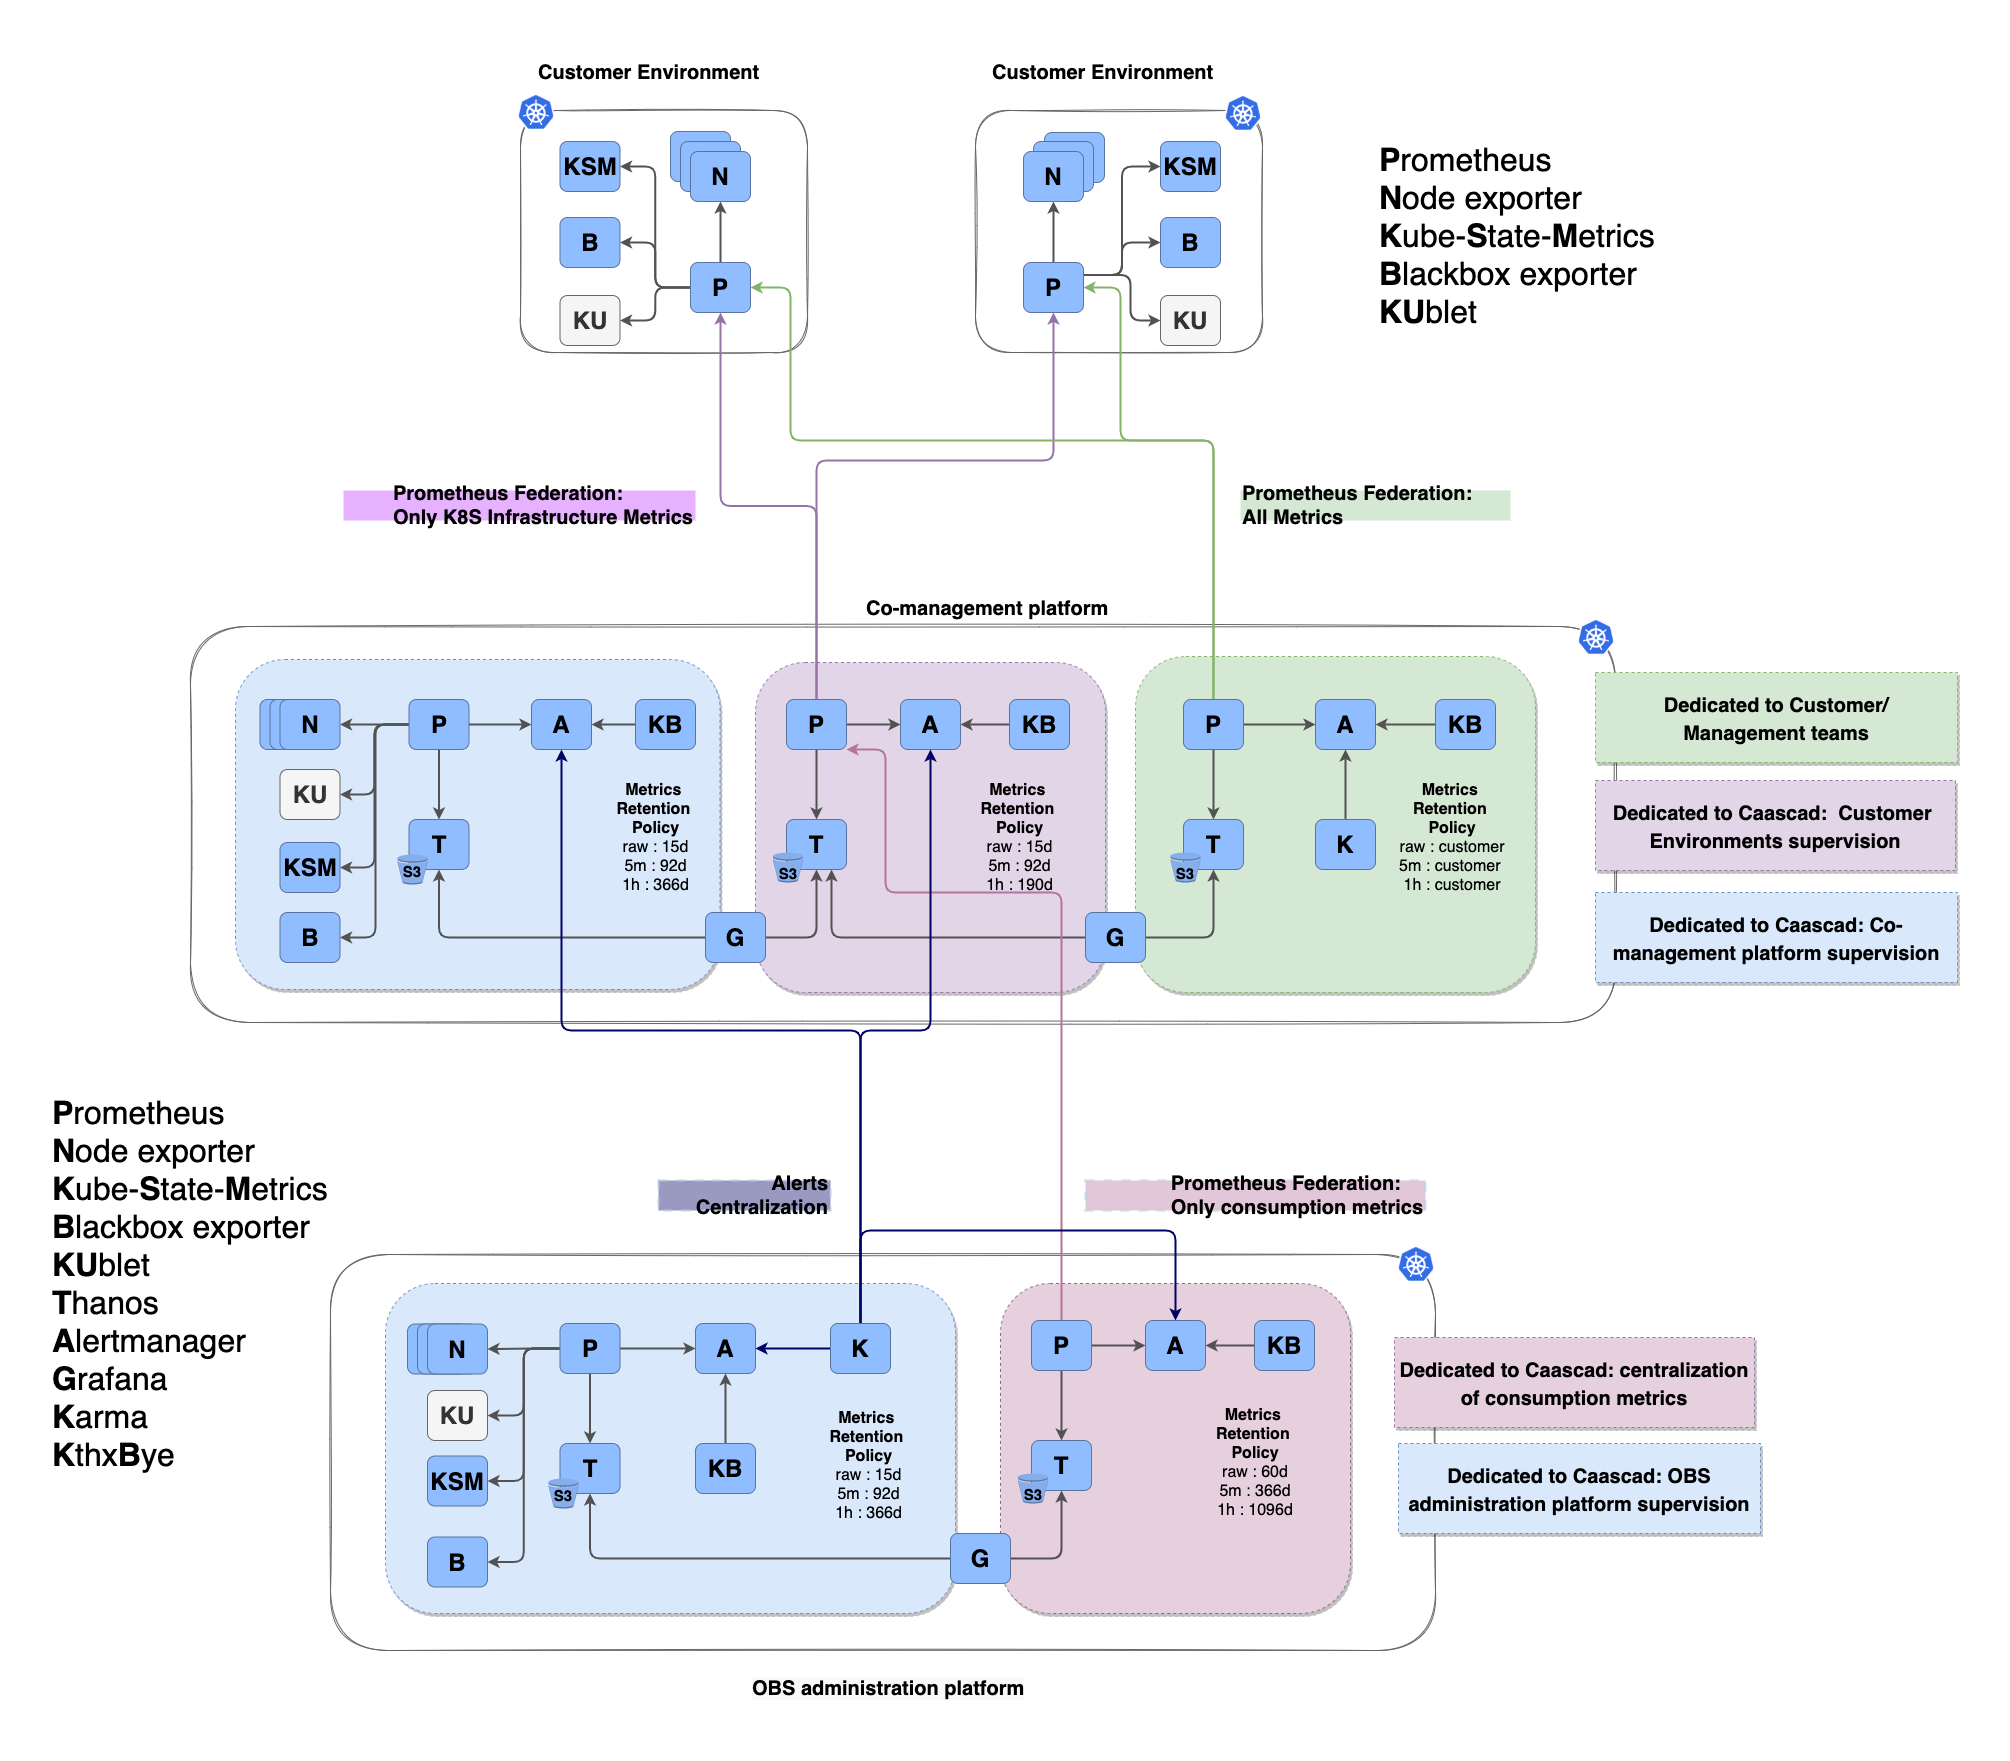
Description of the tools#
Prometheus operator#
Prometheus operator is a Kubernetes operator.
It is deployed only once on the Kubernetes cluster and it will operate all Prometheuses.
Prometheus#
Prometheus is the monitoring tool. It will scrape everywhere it can. Then store the metrics and check rules for alerting.
Prometheus is deployed as a Kubernetes Custom Resource Definition (CRD) and Prometheus-operator deploys a statefulset.app and pods.
Thanos#
Thanos is the long term storage solution for Prometheus. Data are stored in a S3 bucket.
Thanos is made of many components :
- a sidecar for Prometheus : get the metrics of Prometheus and store them in the S3 bucket.
- a store gateway : be a gateway for all operations that need access to the S3 bucket (except initial storage : the sidecar does it)
- a querier : listen for queries (be a datasource for Grafana) and request all storage places (the sidecar and the store gateway)
- a compactor : load the data stored in S3 and 1/ compact it and 2/ generated downsampled data; store the results back in S3.
A schema can be found on https://github.com/thanos-io/thanos.
Kube-state-metrics#
Kube-state-metrics generates metrics about the state of the objects, retrieved from the Kubernetes API Server.
Exporters#
Exporters are sources of metrics. Prometheus scrapes them.
Node-Exporter#
The Prometheus Node Exporter exposes a wide variety of hardware and kernel-related metrics on different Linux host or Kubernetes nodes.
Blackbox-Exporter#
The Blackbox-Exporter allows blackbox probing of endpoints over HTTP, HTTPS, DNS, TCP and ICMP.
Alertmanager#
The Alertmanager is a router for alerts. It listens for alerts (usually from Prometheus). Some routing rules are applied and the alerts are forwarded to other tools (like mails, sms...)
Note : some external tools help to visualize the alerts. Example : Karma.
Kthxbye#
Kthxbye is a simple daemon that works as a sidecar for Prometheus Alertmanager and will automatically extend expiring silences.
Karma#
Karma is an alert visualizer, it permits to classify different alerts according to their severity, labels or description.
Grafana#
Grafana is the visualisation tool.